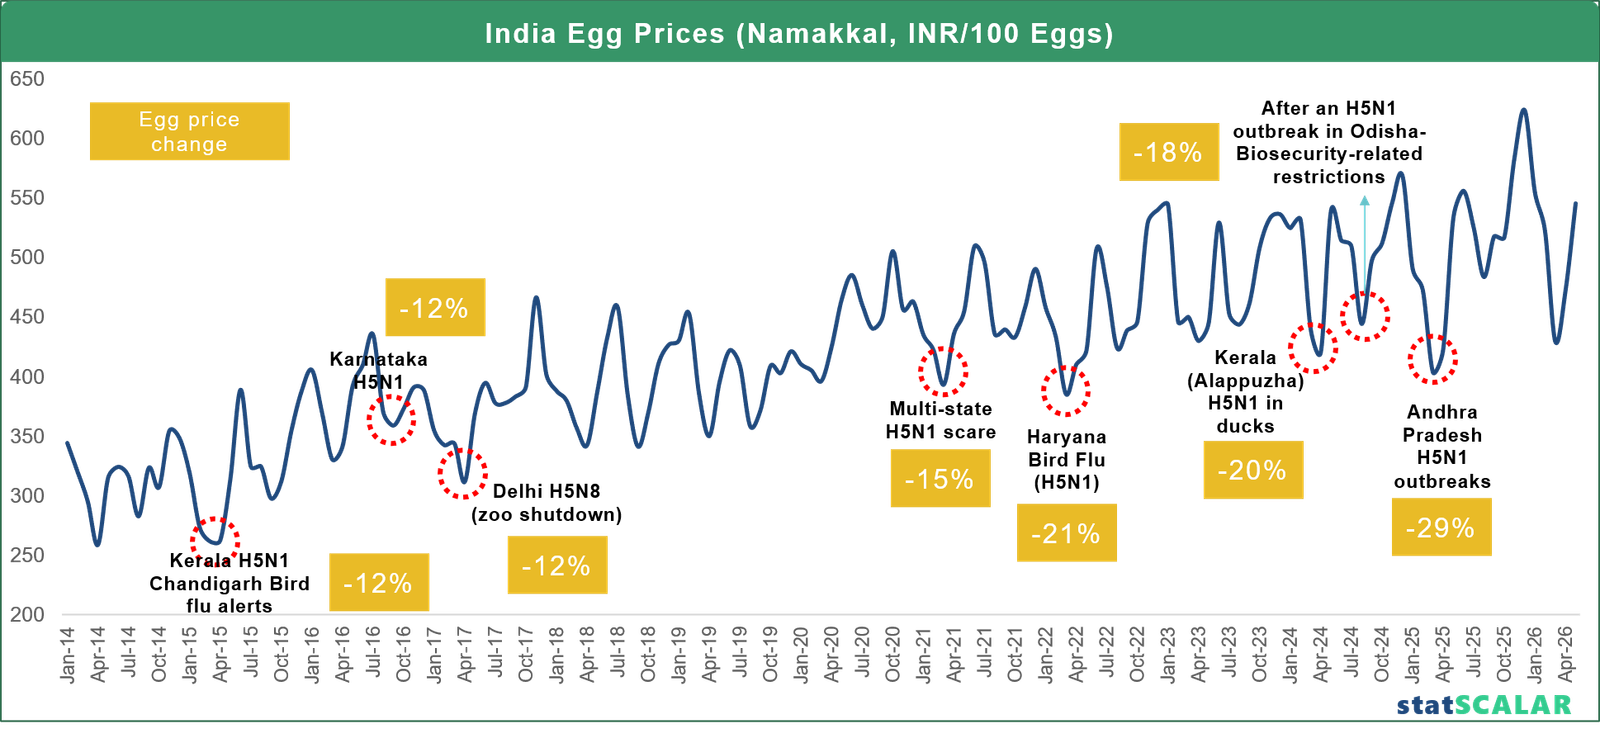
India’s egg market has experienced a clear upward shift in prices over the long term, but the trend has been marked by repeated sharp corrections. The StatScalar chart tracking Namakkal egg prices from January 2014 to April 2026 shows how seasonal movements and disease-related disruptions can create substantial short-term price volatility. Over the period, prices moved from levels around ₹250–₹350 per 100 eggs in the earlier years to frequently above ₹450–₹550 in the later period, while several bird-flu-related events were associated with declines of roughly 12% to 29%.
Why Namakkal Egg Prices Matter
Namakkal is one of India's major poultry production and trading centres, making its egg prices an important reference for understanding domestic market conditions. Changes in prices reflect the interaction of poultry supply, consumer demand, feed costs, seasonal consumption and disease-related risks.
The chart shows that egg prices do not move in a straight line. Instead, they exhibit recurring peaks and troughs, with seasonal lows appearing alongside more pronounced declines during periods of market disruption. This makes bird flu events particularly important for traders and procurement managers attempting to distinguish normal seasonal corrections from fundamental market shocks.
Bird Flu Can Trigger Rapid Price Corrections
One of the strongest patterns visible in the chart is the occurrence of significant price declines around bird-flu-related events. Several marked corrections range from approximately 12% to 29%, demonstrating how quickly disease concerns can affect the poultry market.
The impact is often driven by multiple factors operating simultaneously. News of avian influenza can reduce consumer confidence, weaken demand and encourage precautionary buying behaviour among traders. At the same time, movement restrictions, temporary market disruptions and concerns about poultry mortality can affect supply chains.
Importantly, the price response does not always depend on the actual scale of production losses. Market perception and expectations can be enough to cause a significant short-term price movement.
The 2015–17 Period: Early Price Corrections
During the middle of the 2010s, the chart shows several notable price declines. Prices fell sharply from local highs, including corrections of around 12% during the 2015–17 period.
These movements illustrate the cyclical nature of India's egg market. Periods of strong prices can encourage higher production, eventually increasing market availability and putting downward pressure on prices. Seasonal demand changes can amplify these movements.
For producers, this creates a recurring challenge: decisions made during high-price periods can influence supply several months later, potentially contributing to subsequent price corrections.
2021–22: Renewed Volatility
The chart highlights another series of declines during 2021–22, including corrections of approximately 15% and 21%.
This period demonstrates how disease concerns and market disruptions can occur against an already volatile price environment. Egg prices had moved considerably higher compared with the earlier years, meaning that even a moderate percentage correction represented a significant change in the absolute price per 100 eggs.
For procurement teams, percentage changes therefore need to be considered alongside the underlying price level. A 20% decline from a high-price market can have a much larger financial impact than the same percentage decline from a lower base.
2024–25: Larger Price Swings
The most striking recent corrections shown in the chart include declines of approximately 18%, 20% and 29%.
These events occurred against a much higher overall price range. The market repeatedly reached levels above ₹500 per 100 eggs before experiencing sharp pullbacks. Such behaviour indicates that the market had become increasingly volatile, with supply-demand conditions capable of producing substantial price movements over relatively short periods.
The approximately 29% correction stands out as the largest marked decline on the chart. For businesses exposed to egg procurement costs, such movements can materially affect purchasing strategies, inventory decisions and contract pricing.
Bird Flu Is Only One Part of the Price Equation
Although bird flu is an important market catalyst, egg prices are determined by a much broader set of variables.
1. Feed Costs
Feed represents one of the most important cost components in poultry production. Changes in maize and soybean meal prices can alter production economics and influence farmers' decisions regarding flock sizes.
2. Seasonal Demand
Egg consumption typically changes throughout the year. Weather conditions, school and institutional demand, festivals and changes in foodservice activity can contribute to recurring price patterns.
3. Poultry Supply
Changes in layer flock numbers, productivity, mortality and replacement rates influence the availability of eggs. Higher production can eventually create surplus conditions and pressure prices.
4. Disease Risk
Avian influenza and other poultry diseases can affect both supply and demand. Even rumours or isolated cases may influence market sentiment before the physical supply impact becomes evident.
5. Consumer Behaviour
Disease-related news can change consumer purchasing behaviour. Reduced consumption can accelerate price declines, while restored confidence can support a rapid recovery.
6. Trade and Movement Restrictions
Restrictions on poultry movement or trade can fragment regional markets. A disruption in one production area can produce different price effects depending on local supply and demand conditions.
What the Long-Term Price Trend Reveals
Despite repeated corrections, the broader trajectory in the chart is upward. Namakkal egg prices have moved from predominantly ₹250–₹400 per 100 eggs in the earlier years to much higher levels in the 2020s, with prices reaching above ₹600 at a major peak in late 2025 before another sharp correction and subsequent recovery.
This suggests that the structural economics of the egg market have changed over time. However, the upward trend should not be interpreted as a continuous increase. Instead, the market appears to operate through cycles of price increases followed by sharp corrections.
This distinction is particularly important for procurement managers. Buying decisions based solely on the long-term direction can overlook the significant opportunities created by short-term corrections.
How Procurement Managers Can Use Bird Flu Events
For procurement and trading teams, bird flu events should be treated as early-warning indicators rather than standalone price signals.
A useful market-monitoring framework would combine:
- Namakkal egg prices
- Bird flu outbreak reports
- Layer flock and production estimates
- Maize prices
- Soybean meal prices
- Regional wholesale prices
- Seasonal demand patterns
- Poultry mortality indicators
- Export demand
- Movement and trade restrictions
Monitoring these indicators together can help determine whether a price decline is likely to be a temporary market reaction, a seasonal correction or a more fundamental supply-demand adjustment.
Conclusion
The Namakkal egg price series demonstrates the strong relationship between poultry disease events and market volatility. While bird flu can trigger rapid price declines through changes in demand, supply expectations and market sentiment, the underlying price trend is also shaped by feed costs, production cycles and seasonal demand.
The key takeaway for market participants is that egg prices should be analysed through both trend and event-based lenses. Long-term price direction provides the structural picture, while bird flu events and other disruptions explain many of the sharp short-term movements.
For traders, poultry producers and procurement managers, combining historical price data with event analysis can provide a more informed view of when prices are undergoing a normal seasonal correction and when a larger market disruption may be developing.